Journey to Carbon Neutrality for Sophia from 2020 to 2024
- Sophia School Corporation
Developments in de-carbonizing Sophia
2024
Sophia University’s Yotsuya Campus Introduces Off-site Physical Corporate PPA Using Renewable Energy-based Electricity
Under this physical power purchase agreement or PPA※1 , Sophia University will receive supply with renewable energy with additionality※2 purchased from a new solar power plant (total
generation capacity: approximately 2 MW) to be established within an area covered by Tokyo
Electric Power, as well as electric power endorsed with a non-fossil certificate with tracking
information※3. This will bring the net renewable energy ratio for electric power used in the Sophia
University campus to 100%, including additionality.
※1 Under the physical power purchase agreement (PPA), electric power produced using renewable energy is sourced offsite from locations other than the demand area. The renewably generated power, together with the
resulting environmental value, is supplied to users through the General Electric power grid.
※2 “Additionality” refers to the effect of encouraging further investment in new renewable energy facilities, created by third parties’ commitment to purchasing renewable electric power, certificates, and credits.
※3 A non-fossil certificate that identifies the source of the electric power.

Sophia University Estimation Results of Scope 1-3 Greenhouse Gas Emissions in FY2023
Sophia University’s Office of Environment and Facility Management has been calculating Scope 1 and 2 emissions and estimating Scope 3 emissions related to infrastructure (mainly water, sewage, and waste).
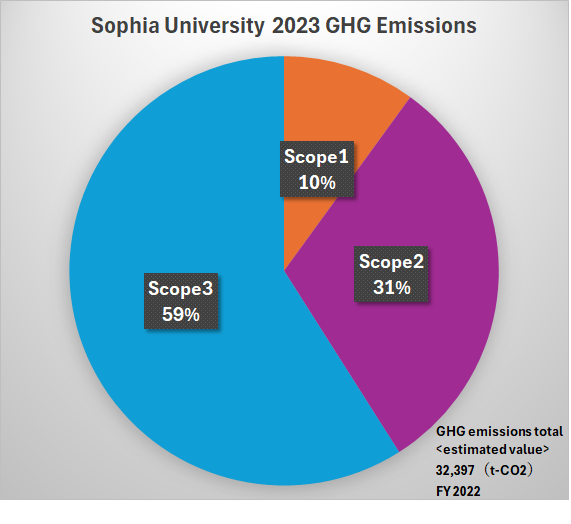
Based on this, we estimated the remaining Scope 3 emissions (emissions related to business activities) from our financial statements to be disclosed. As a result, Scope 3 emissions covered approximately 60% of total emissions, followed by Scope 2 emissions accounting for 30% and Scope 1 emissions accounting for the remaining 10%.
We will harness these results to promote energy conservation and creation and to further reduce emissions associated with our business activities. We will also continue to improve the accuracy of our estimates (including coverage).
<Conditions>
(1) Calculations are based on the amount of activity for fiscal year 2022.
(2) Scope 1 refers to emissions from the use of fuels and city gas.
This is obtained and applied from the Act on the Rational Use of Energy (Greenhouse Gas Emissions Accounting and Reporting System).
(3) Scope 2 refers to emissions from the use of electricity.
This is obtained and applied from the TEPCO Energy Partner CO2 Emission Coefficient (2022).
(4) Scope 3 mainly covers upstream activities and is estimated based on our financial statements, etc.
Emission factors are mainly obtained from the Green Value Chain Platform, and the following are individually cited.
・For water and sewage, the emission factor from the Tokyo Cap & Trade Program is used
・For waste, the Yotsuya and Mejiro-Seibo campuses were covered, using the LCI database IDEA Version 2.3
・For transportation costs, the LCI database IDEA Version 2.3 is referenced
*IDEA is the copyrighted work of the IDEA Laboratory, Safety Science Research Division, National Institute of Advanced Industrial Science and Technology (AIST), and the Sustainable Management Promotion Organization.
(5) The following are currently excluded from calculations
・Emissions from refrigerant leaks from air conditioners
・Emissions from chemical substances used in experiments that are released into the atmosphere
・Emissions from student commuting
・Emissions related to all downstream activities, including investment, except for leased items
・Student dormitories located outside the campus, and meter-rate and flat-rate lighting contracts
Recent feedback from Tokyo Metropolitan Government based on the Tokyo Cap-and-Trade Program (comparison in FY2022)
Sophia University’s GHG emissions are about 43% less than the average of 65 academic institutions in Tokyo (Edu. Av) . This is equivalent to almost 24% less than the average for the top 25% of the above institutions (Edu. 25). All of these results resulted in significant reductions in CO2 emissions per unit floor area. Comparison of GHG emissions from Sophia University and academic institutions in Tokyo

2023
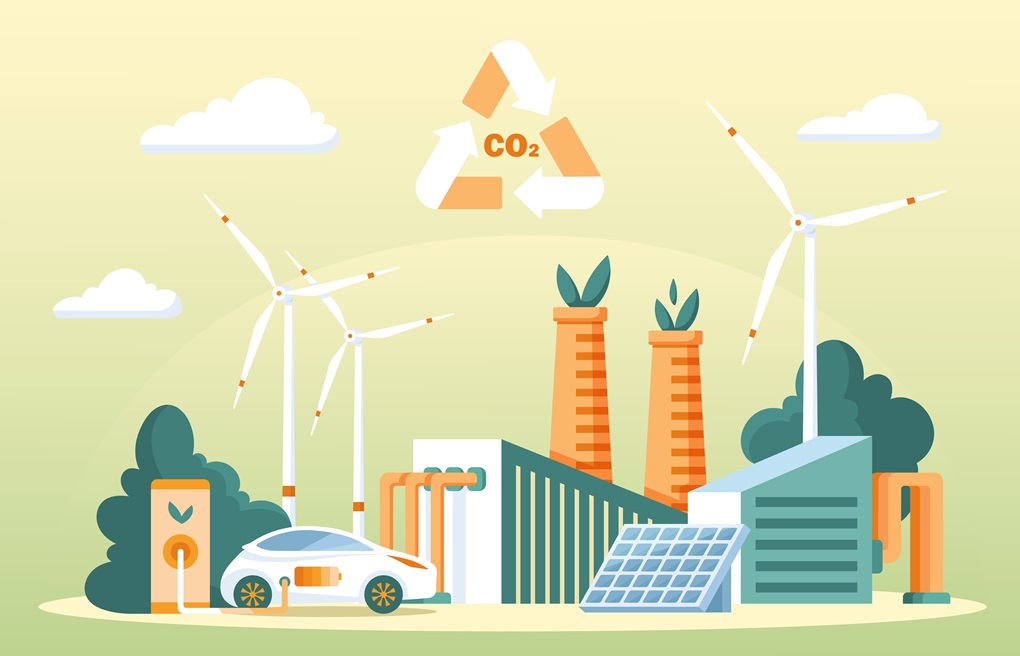
From June 1, 2020, when Sophia University introduced 100% renewable electricity at Yotsuya Campus (Chiyoda-ku, Tokyo), it has been gradually introducing renewable electricity at its other campuses. The remaining low-voltage power used at Hadano Campus is now sourced by 100% renewable electricity ※1 as of November 2023.
As a result, the electricity used on all Sophia University campuses, which collectively amount to approximately 22 million kwh per year, has been replaced by renewable energy which virtually does not emit carbon dioxide. We have achieved the target set by the Renewable Energy University League of Japan to convert all electricity used on campus to renewable power during 2030-40 ahead of schedule. ※2
※1 The renewable electricity is in line with the criteria set out by RE100, a global initiative.
※2 Electricity consumption in FY2022.
Renewable Energy University League Website: https://www.re-u-league.org/about-1/
This excludes off-campus dormitories, leased properties where we bear no authority, and meter-rate/flat-rate lighting.
[Recent inventory and goals]
We reduced emissions by 13,026 t-CO2 as a voluntary initiative, compared to 13,615 t-CO2 emissions in FY2023
Scope 1 : 3,078t-CO2
Scope 2 : 9,971t-CO2 (location-based)
Scope 3 : 566 t-CO2 (We seek to work in parallel to improve the scope of calculation and increase emission reductions in the future.)
*The LCI database IDEA Version 2.3 is cited for Scope 3 calculations.
(Copyrighted work of IDEA Laboratory, Safety Science Research Division, National Institute of Advanced Industrial Science and Technology (AIST) and the Sustainable Management Promotion Organization, Inc.)
[Sophia School Corporation (Higher Education Sector) Environmental Impact in 2023]
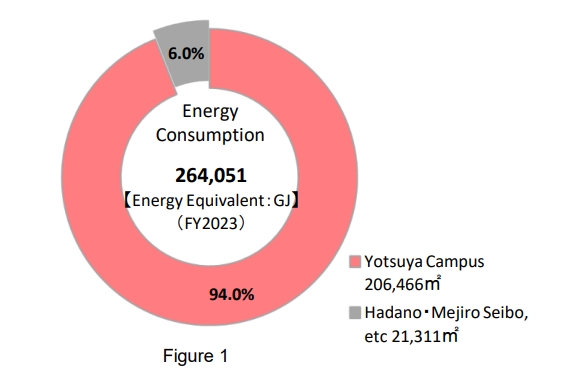
Sophia School Corporation’s higher education division consists of three main campuses: Yotsuya Campus, Mejiro Seibo Campus, and Hadano Campus. Students from all undergraduate and graduate schools of Sophia University receive education and conduct research at the Yotsuya Campus. Some students from the Department of Nursing, Faculty of Human Sciences, use the Mejiro Seibo Campus, while the Hadano Campus is home to the Sophia University Junior College Division. In 2023, 94.0% of energy consumption was at the Yotsuya Campus.
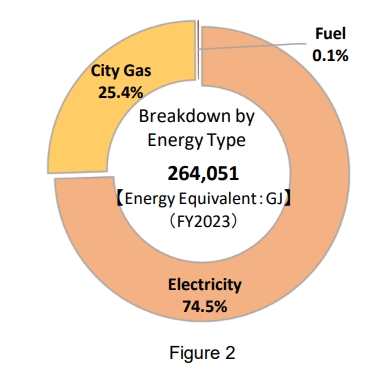
Energy consumption is split into electricity (74.5%) and city gas (LNG) (25.4%). Fuels (such as kerosene) are primarily used for heating at the Hadano Campus, but their share of the total is extremely low. In terms of facilities, greenhouse gas emissions at the main campuses are primarily due to energy use, as well as water and sewage use and waste disposal. Greenhouse gas emissions associated with these uses were estimated based on the amounts used and disposed of in2023. Greenhouse gas emissions (carbon dioxide equivalent) in 2023 were 13,615 t-CO2, with electricity use accounting for approximately 73.2% and city gas (LNG) use accounting for approximately 22.4%.
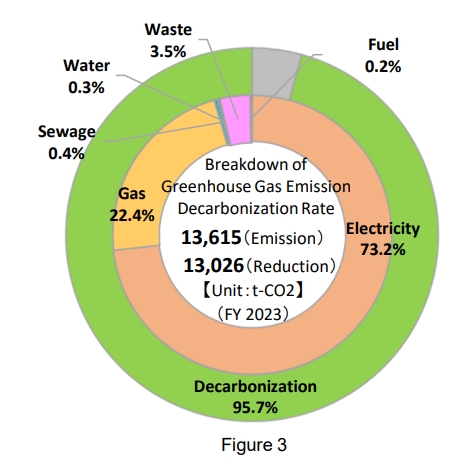
Sophia School Corporation is switching to electricity sourced essentially 100% from renewable energy sources on its main campuses between fiscal 2020 and 2023. Furthermore, in fiscal 2021, city gas at the Yotsuya and Mejiro Seibo Campuses was switched to carbon-offset LNG, and the Hadano Campus will follow suit from fiscal 2024. As a result, carbon-offset LNG has been introduced on all campuses that use city gas. As a result, with the exception of a few facilities, greenhouse gas emissions from electricity and city gas use have been reduced to virtually zero, and this voluntary initiative has resulted in a significant reduction of 13,026 t-CO2 (approximately 95.7%). While carbon dioxide emissions from energy use have been significantly reduced, energy consumption in fiscal 2023 will exceed that of the previous year. Furthermore, as future increases in energy and environmental value are likely to result in rising energy prices, it is believed that behavioral change is necessary from a cost perspective as well, both in terms of hardware (improving the efficiency of equipment, such as by promoting the use of LED lighting) and software (promoting energy-saving activities).
Sophia School Corporation’s total annual energy consumption exceeds the standards set out in the Act on the Rationalization of Energy Use (Energy Conservation Act), and as such has been designated as a specific business operator under the Act as a company that is particularly in need of promoting the rationalization of energy use. Each year, the company reports its energy consumption and plans for reducing energy consumption to the Ministry of Economy, Trade and Industry (Agency for Natural Resources and Energy) and the Ministry of Education, Culture, Sports, Science and Technology. In addition, under the Act on Promotion of Global Warming Countermeasures, the company is required to report its greenhouse gas emissions to the Ministry of the Environment each year and is obligated to reduce its total greenhouse gas emissions under the Ordinance on the Environment to Ensure the Health and Safety of Tokyo Citizens (Environmental Security Ordinance).
2022
Yotsuya Campus accounts for 94.2% of the energy collectively consumed at Sophia University’s major campuses※1(Figure 1). By energy type, electric power accounts for 77.1% and city gas (LNG※2), 22.8%. Fuels (heavy oil, etc.) are used for heating, etc. at Hadano Campus, but accounts for a very small fraction. (Figure 2)
Greenhouse gases emitted by facilities on main campuses include not only those from energy use, but also emissions associated with water use, sewage, and waste treatment. Greenhouse gas emissions were estimated based on such use and waste volumes in fiscal 2022※3 . Greenhouse emissions (CO2 equivalent) in fiscal 2022 amounted to 13,846 tons, with electric power consumption accounting for around 73.1% and city gas (LNG), for around 23.1% (Figure 3). From fiscal 2020 through fiscal 2021, Sophia University has procured 100% renewable power for our main campuses. In fiscal 2021, Sophia University procured carbon neutral LNG※4 for the Yotsuya and Mejiro Seibo campuses. This has led to substantially net zero greenhouse gas emissions from electric power and city gas use, with the exception of some facilities, thus significantly reducing emissions by around 94.9%.
※1 Energy consumption in fiscal 2022
※2 Liquefied natural gas
※3 Estimations for emissions from water use and sewage are based on the emission coefficient under the Tokyo Cap & Trade scheme.
Waste volume estimations were conducted for the Yotsuya and Mejiro Seibo campuses based on LCI Database IDEA Version 2.3 (copyrighted work by the Research Institute of Science for Safety and Sustainability, National Institute of Advanced Industrial Science and Technology (AIST) and Sustainable Management Promotion Organization)
※4 Virtually zero-emission LNG that has offset greenhouse gas emissions generated from well to combustion with credits
※5 Rented areas and dormitories, etc
2021

We switched our entire natural gas consumption to carbon-neutral LNG*.
We use city gas that offsets the greenhouse gas equivalent emitted from natural gas extraction to combustion with the greenhouse gas equivalent absorbed through forest conservation and afforestation, etc ; and therefore, we virtually emit no greenhouse gases.
2020

Sophia introduced the Premium Zero Plan, an electricity procurement scheme that allows us to use 20 million kWh per year of renewable energy, which amounts to 95% of the electric power used at our main Campus in Tokyo.
*100 Renewable No greenhouse gases are emitted as power is sourced from renewable energy, such as solar, wind and biomass, and does not include nuclear or fossil sources. (We do not use Non-fossil Fuel Certificates (NFCs) to offset fossil fuels.)

